Orbit International (ORBT) is a really interesting stock due to the company’s operating leverage, which I believe is not recognized by the market.
Mainly due to the United States budget sequestration in 2013 the company had to implement significant cost savings in order to return to profitability. One of the largest projects was a consolidation of two manufacturing facilities into one.
https://en.wikipedia.org/wiki/United_States_budget_sequestration_in_2013
Mitchell Binder, President and CEO of Orbit, commented, “We were driven to this decision by a number of factors, among them, a difficult business environment due to budgeting concerns in Washington, our broader focus on promoting operating efficiencies, and TDL’s expiring lease. This consolidation is expected to reduce excess capacity at our Hauppauge facility, provide the advantage of greater manufacturing capabilities offered by our ISO 9001:2008 operations, reduce labor and overhead costs, and boost margins, all while maintaining the world-class level of service that our customers have come to expect.”
Mr. Binder added, “After consolidation of these two facilities, our Hauppauge facility will have sufficient capacity to support future growth without any significant facility investment.”
Following the implemented cost savings, the company has returned to profitability. However, revenue is still low. Investor’s haven’t seen the effects of the new cost structure combined with higher revenues (yet). Incremental revenue, on top of 2016 revenue of 21m USD, is estimated to flow to the bottom line at 55-65%.
Although it is difficult to form a view on the likelihood of the company generating additional revenue over the next couple of years, I believe it is more likely than not. If the company can increase their revenue by 6-9m USD this will increase earnings by 0.90-1.35 USD / share. Shares currently trade at 4.30 USD. The downside seems well protected. The company has no long-term debt and I estimate new break-even revenue at ~17-18m USD, a level they have always exceeded over the last 10 years.
| Year | Revenue (m USD) |
| 2007 | 26 |
| 2008 | 28 |
| 2009 | 27 |
| 2010 | 27 |
| 2011 | 31 |
| 2012 | 29 |
| 2013 | 25 |
| 2014 | 19 |
| 2015 | 20 |
| 2016 | 21 |
| 2017 | More than 21 |
If the company manages to run at 100% utilization this will boost earnings per share by 1.35 USD
The company’s manufacturing facility ran at 70% utilization during 2016 (~21m USD in revenue). The company’s management believes that additional revenue can be served without additional overhead costs. They estimate that every additional dollar of revenue flows to the bottom line at 55-65%. If they manage to fill the available capacity, this will have a significant effect on earnings:
80% utilization: 21m USD/7 *1*60% = 8m USD –> 1.8m / 4m shares outstanding = 0.45 USD EPS growth
90% utilization: 21m USD/7 *2*60%= 6m USD –> 3.6m / 4m shares outstanding = 0.90 USD EPS growth
100% utilization: 21m USD/7 *3*60%= 4m USD –> 5.4m / 4m shares outstanding = 1.35 USD EPS growth
Revenue grow seems more likely than not
The company expects that there revenue in the 2nd half of this year will be better than the first half. They have good insight into quarterly revenues due to agreed delivery schedules with customers. So we may see some of the operating leverage effect in the next two quarterly reports. However, the real question is if they will be able to grow revenues significantly (3-9m USD).
It is very difficult to answer this question, but available information makes me believe it is more likely than not (at least a couple of million).
- Tuck in acquisitions: the company is constantly looking for “tuck-in” acquisitions to make use of their available manufacturing capacity. So far without luck, which is probably price related. The company intends to pay 3.5-4 times EBITDA + earn-outs, which is low in the current M&A environment. In January the company was in talk with two potential targets, there has been no further news since then. I have no real expectations, but their persistence may pay off one time.
- Oil price recovery: the power segment business heavily depends on the oil industry. Revenues have been lower due to the low oil price. If the oil price recovers and investments pick up in this sector, this may give a nice boost to revenue.
- Historic revenue: Before the sequestration the company managed to do 25-30m USD annually in revenue.
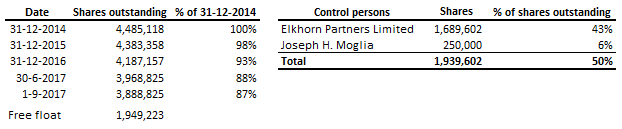
- Management optimism + share buybacks: Reading through all the press releases of the current management team, you can clearly see that their tone changed and that they are more optimistic that their revenue will increase. Both via organic growth and due to increased defense spending by the US government. That is also one of the reasons they continue to buy back shares. This year they have been very aggressive buying back shares reducing shares outstanding by 7.1% YTD (my estimate), which may increase to 9.8% if they can utilize the remaining funds in the buyback program.

Interesting find. However, I’m not as optimistic as you are. This is a microcap company that has performed horribly the past ten years. They wins orders through a competitive bidding process. Gross margins have been $30m revenue. Do you really think they can suddenly start selling stuff with 65% net profit margins? No matter what management tells you, this is not Google. If that’s your base case scenario you are bound to be disappointed imho.
On the flip side, at a $18m valuation you aren’t paying that much for the optionality I guess.
LikeLike
*they win orders through a competitive bidding process. Gross margins have been hovering under 40% for a long time, even when they had $30m in revenue.
LikeLike
Hi Pietje,
Thanks for your comment!
Last time they had $30m in revenue, their cost base was very different. They had two manufacturing facilities and far more expensive overhead (SG&A).
Their cost of goods sold includes production costs (which includes overhead). Hence the gross margin figure does not necessarily show the margin of incremental revenue.
Management has been very conservative over the last couple of years in what they communicate to shareholders. 65% is not a base case scenario, but I believe that incremental revenue can flow to the bottom line at a rate significantly above 40%.
It is possible though, that this unusually large win as a result of a competitive bidding process has lower margins.
Maarten
LikeLike
From todays press release:
“The shipment and delivery of these units will require many aspects of production and testing to be offloaded to subcontractors and as a result, our expected gross margins for this contract will be considerably lower than our historical margins”
LikeLike
I think you are right on regarding incremental revenue. Compare quarters on a sequential basis. Q2 15 incremental margin 67%. Q1 16 77%. Q3 2016 62%. This is totally normal for a company this size in this industry operating at 70% of capacity.
The new order is a little different since some of it is subcontracted. Typical incremental revenue will basically involve only incremental direct labor and materials, no additional overhead (rent, utilities, insurance) or indirect labor (supervision).
LikeLiked by 1 person